To set up Alerts, insights and logs for a VM deployed on Azure
Outcome
You should be able to make your own VM and set up Azure monitor for that resource
In this entry I decided I wanted to set up Azure Monitor for a VM. VMs are a powerful took in almost any organisation, you use them for applications, hosting, servers and so much more. Azure has a very rich resource set up when it comes to it’s VMs. Without going into to much depth Microsoft have made something that takes a lot of the old on prem methods away leaving you with a very fresh and easy to use GUI. You can name it, add your subscription and resource group. Give it a name username and password and you’re almost ready to go.
In this entry you’re going to see how to monitor this resource by using Azure Monitor so you can get rich diagrams showing real time data, alerts when metrics go above a threshold and also viewing the rich log environment azure offers.
Step 1 - Boot your Azure Portal
Step 2 - Head over to the VM blaze
Step 3 - Make a basic Azure VM
Step 4 - Fill Out The Information GUI
Our first step is to create the VM – We need to set up the VM so we can start to edit the resource to be monitored. In this example I didn’t need a running OS that could be interacted with so I used a basic windows server datacenter OS. This will boot a command line instead of an interface like what you might be using now on a computer. I made the most basic VM as I didn’t need anything to infrustructure driven. I have already made my resource group – I would advise you make one too as this is a centralised location where you can store all resources related to an entire solution.
I also enabled RDP rules so I could remote onto the server later when it was deployed and running. The next step we need to do is deploy the VM and then create a “Log Analytics Workspace” The same as making the VM, search for Log Analytics Workspace and click on the icon. When you have done this press create.
Step 5 - Create your Log Workspace while the VM deploys
Step 6 - Return to your VM when deployed
Step 7 - Head to the Monitor > Insights Blaze
Step 8 - Enable VM Insights
By enabling the insights in the VM you begin the process of setting up Azure monitor. You’ll be able to collect logs from the VM while it runs generating rich runtime diagrams
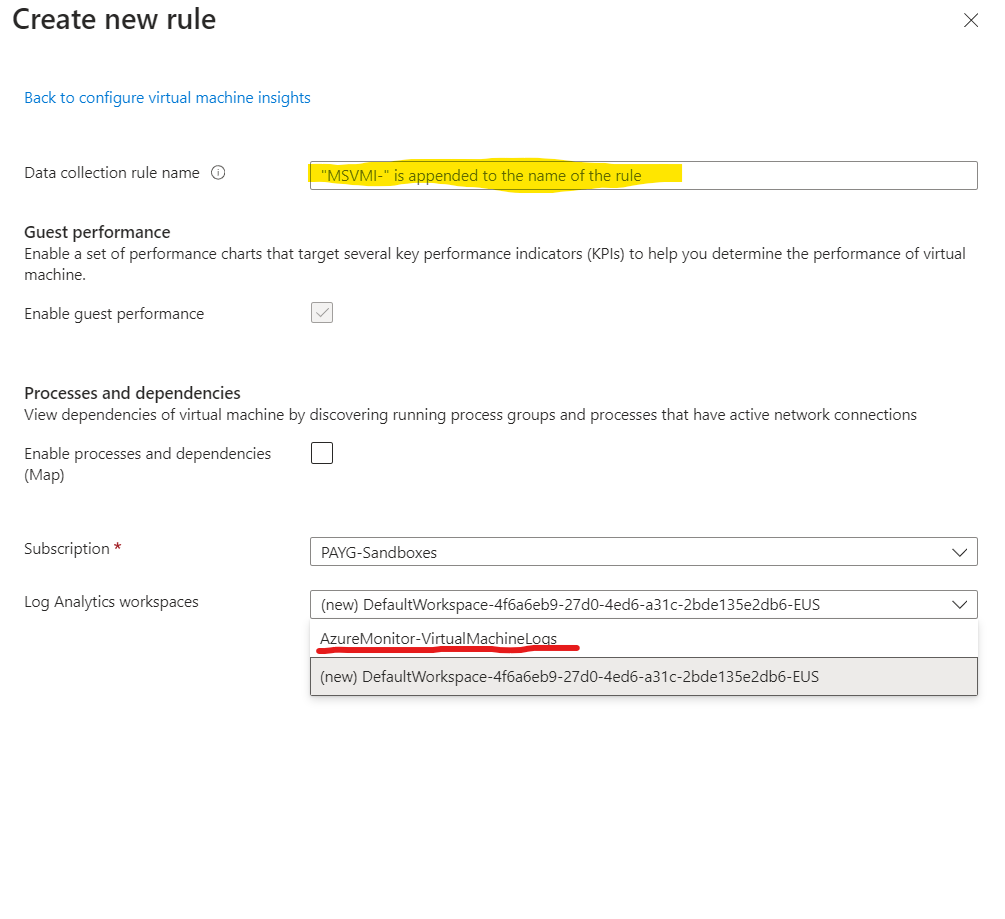
Step 9 - Create your new data collection rules
You can see from step 10 that we link our Log Analytics Workspace – Now you can see why we made it earlier. One while the VM deployed it gave us time to create it instead of waiting. It also was required for this step – It’s best to stay ahead then behind.
Currently we are making the data collection rules as we will nee this later for running alerts.
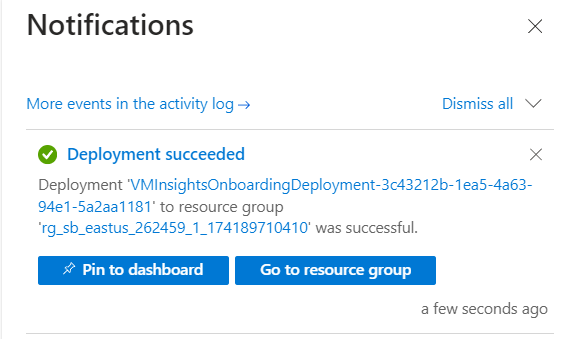
When you are done making the data collection rule you’ll need to wait for it to deploy
Step 10 - Link your "Log Analytics Workspace "
Step 11 - Wait for the rule to deploy
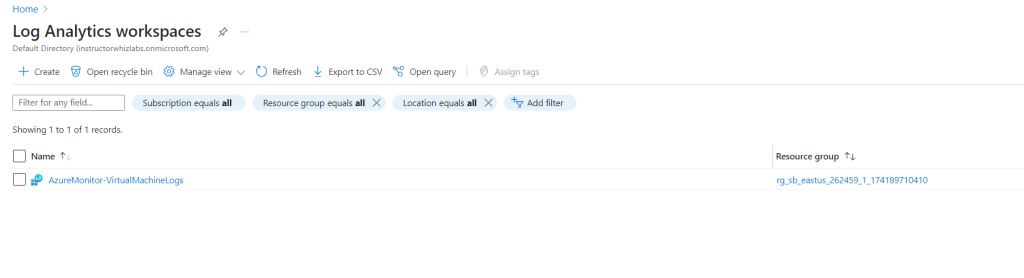
Step 12 - Return to the Log Analytics Workspace
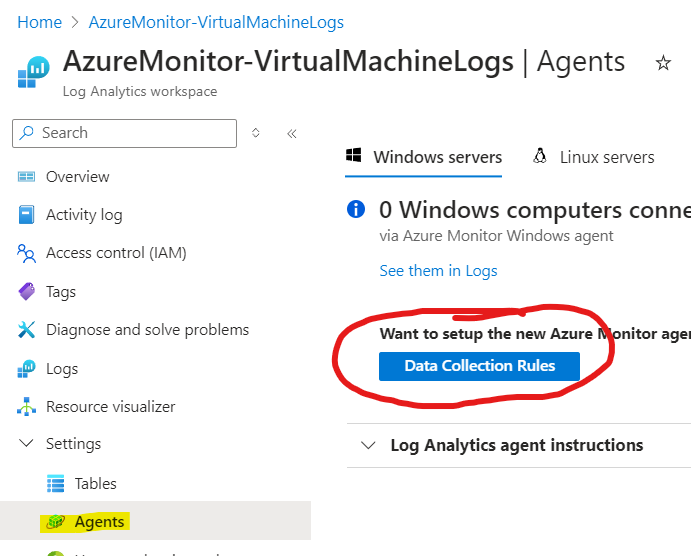
Step 13 - Create a new Data Collection rule in the Agents tab
Step 14 - Create a new
Step 15 - Enter basic information via the GUI
Step 18 - Pick the data Source you want to monitor
Step 16 - Link the VM resource
Step 17 - Create a new Data source
Step 19 - Link Log Analytics Workspace
Bit of a chunky step here but lets recap and explain what we just did.
We deployed our Data collection rule which we are going to need later to make rules based on conditons and actions. We will set these up for the VMs alerts when something happens like a restart or a power amount being met. Next after it was deployed we went back to our Log Analytics Workspace because we wanted to set up an agent – This agent would use the same data collection rule we just created. You can see from step 14 that we create a new one just for demonstration but when we create the VM collection rule one got made which you can see with the blue underline.
We created a brand new data collection rule inside the Log Analytics Workspace – We named it and linked it to a subscription and the resource we want it to monitor, being the VM. When we did this we set Data Sources that we would monitor. I chose “Performance Counters” this being the VMs CPU, Memory, Disk Space but I excluded Network for this example.
We then needed to pick a location where this data would output too and I picked the Log Analytics Workspace as this is where we would store this data. Now we’re going to set up an alert that will email you when a specific conditon is met.
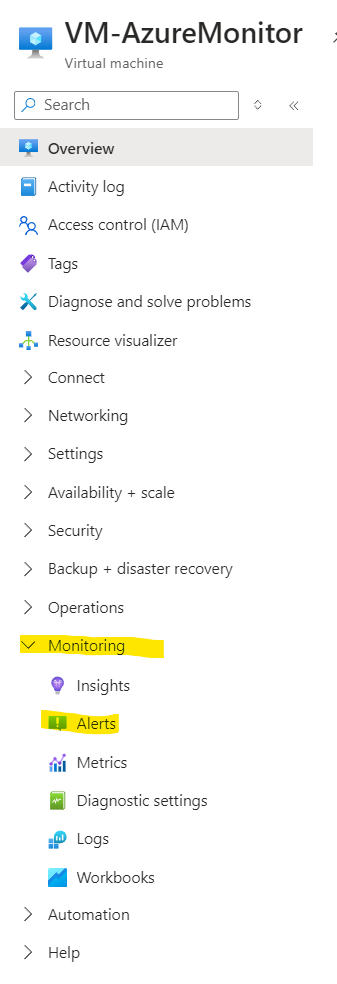
Step 20 - Return to the VM and go to the Alerts Blaze
Step 21 - Click Create Custom Alert Rule.
Step 22 - Set up a condtion that monitors CPU perofrmance
Step 24 - Create an action group so you can add what happens like SMS or Email
Step 26 - Create the group
Step 23 - Choose what we do when the condition is met
Step 25 - Set up your preferred notification type
So now we have a few things.
We’ve made insights so we can see vast digarams about the health of our VM in diagram format and we now have an alert system that will email us if our VM CPU Power goes over 30. It may be better if you set this to a very low number so you can test to make sure your alert does. You can however use the Azure App for push notifications or SMS if you prefer a text. Azure is agile so it can notify you in more than one way.
Step 27 - Go and search for the Monitor Item
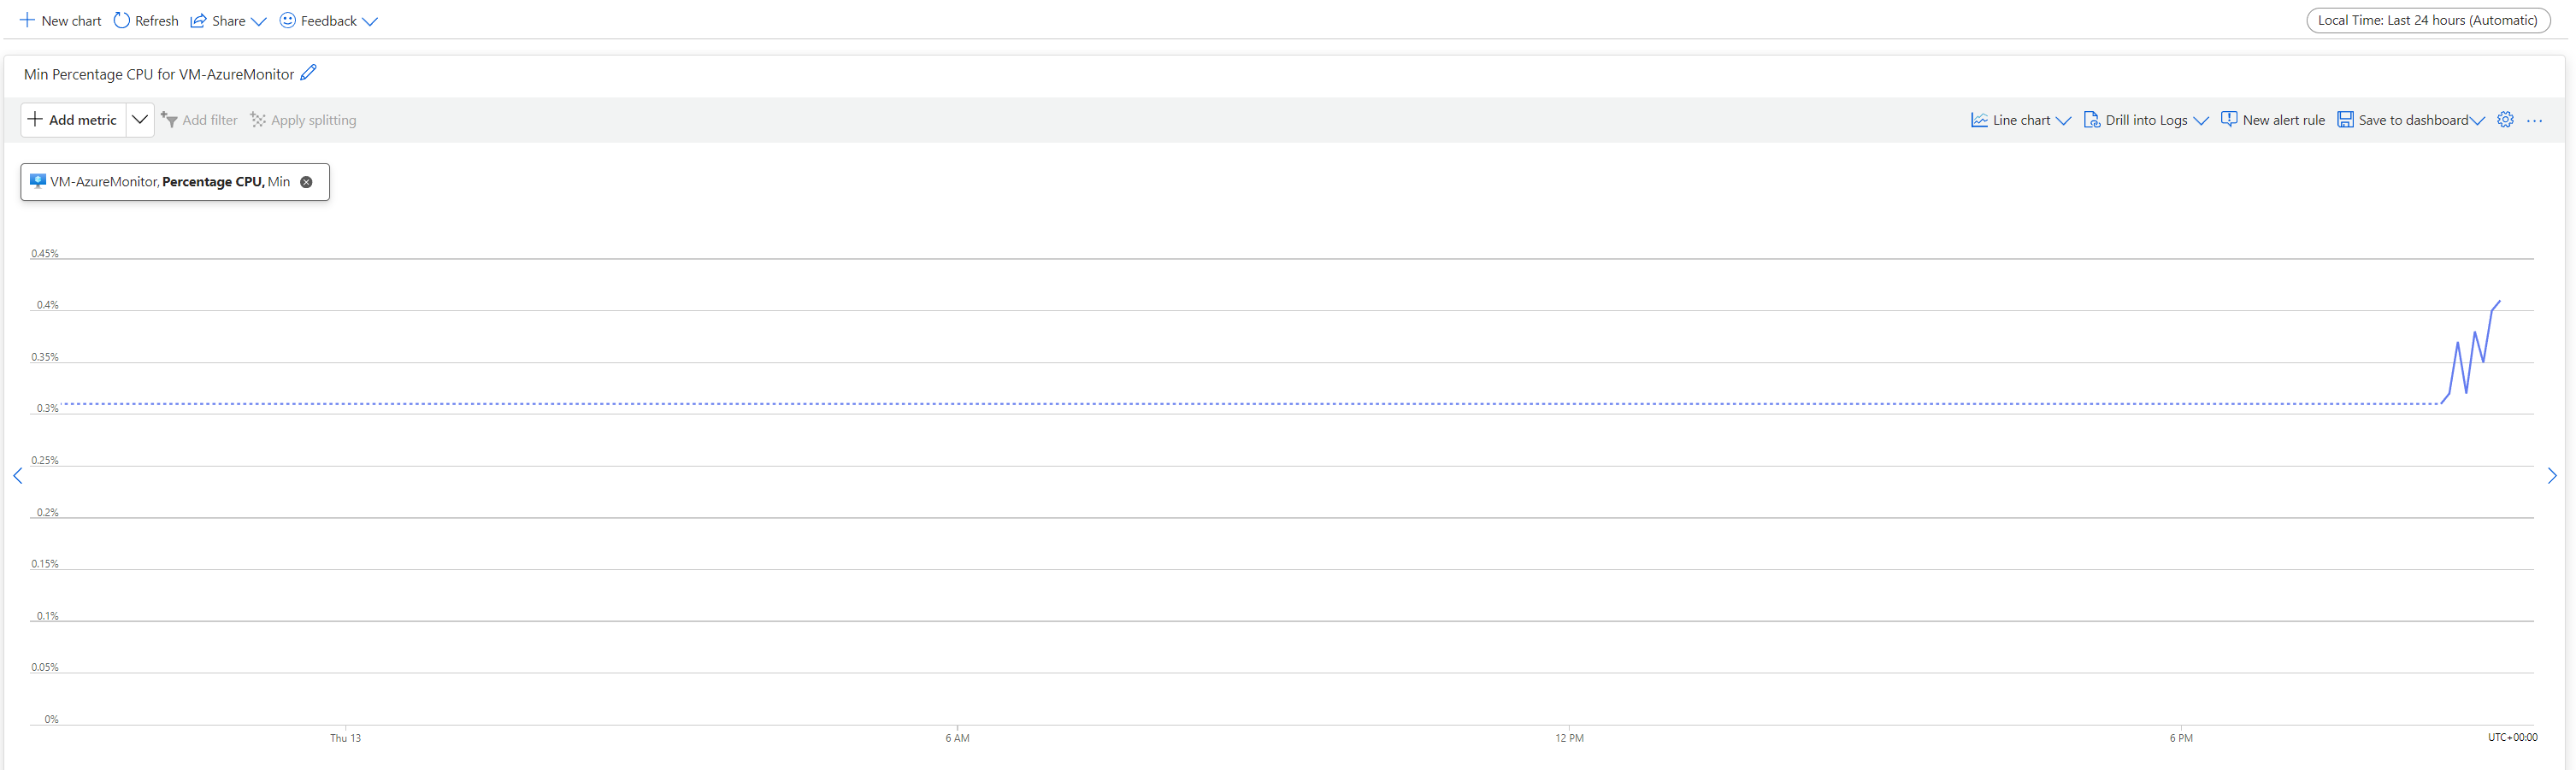
Step 28 - Go to Metrics - You can select your scope of what you want to see, Click your VM
Step 29 - You'll see the metrics with whatever you want to see about the VM
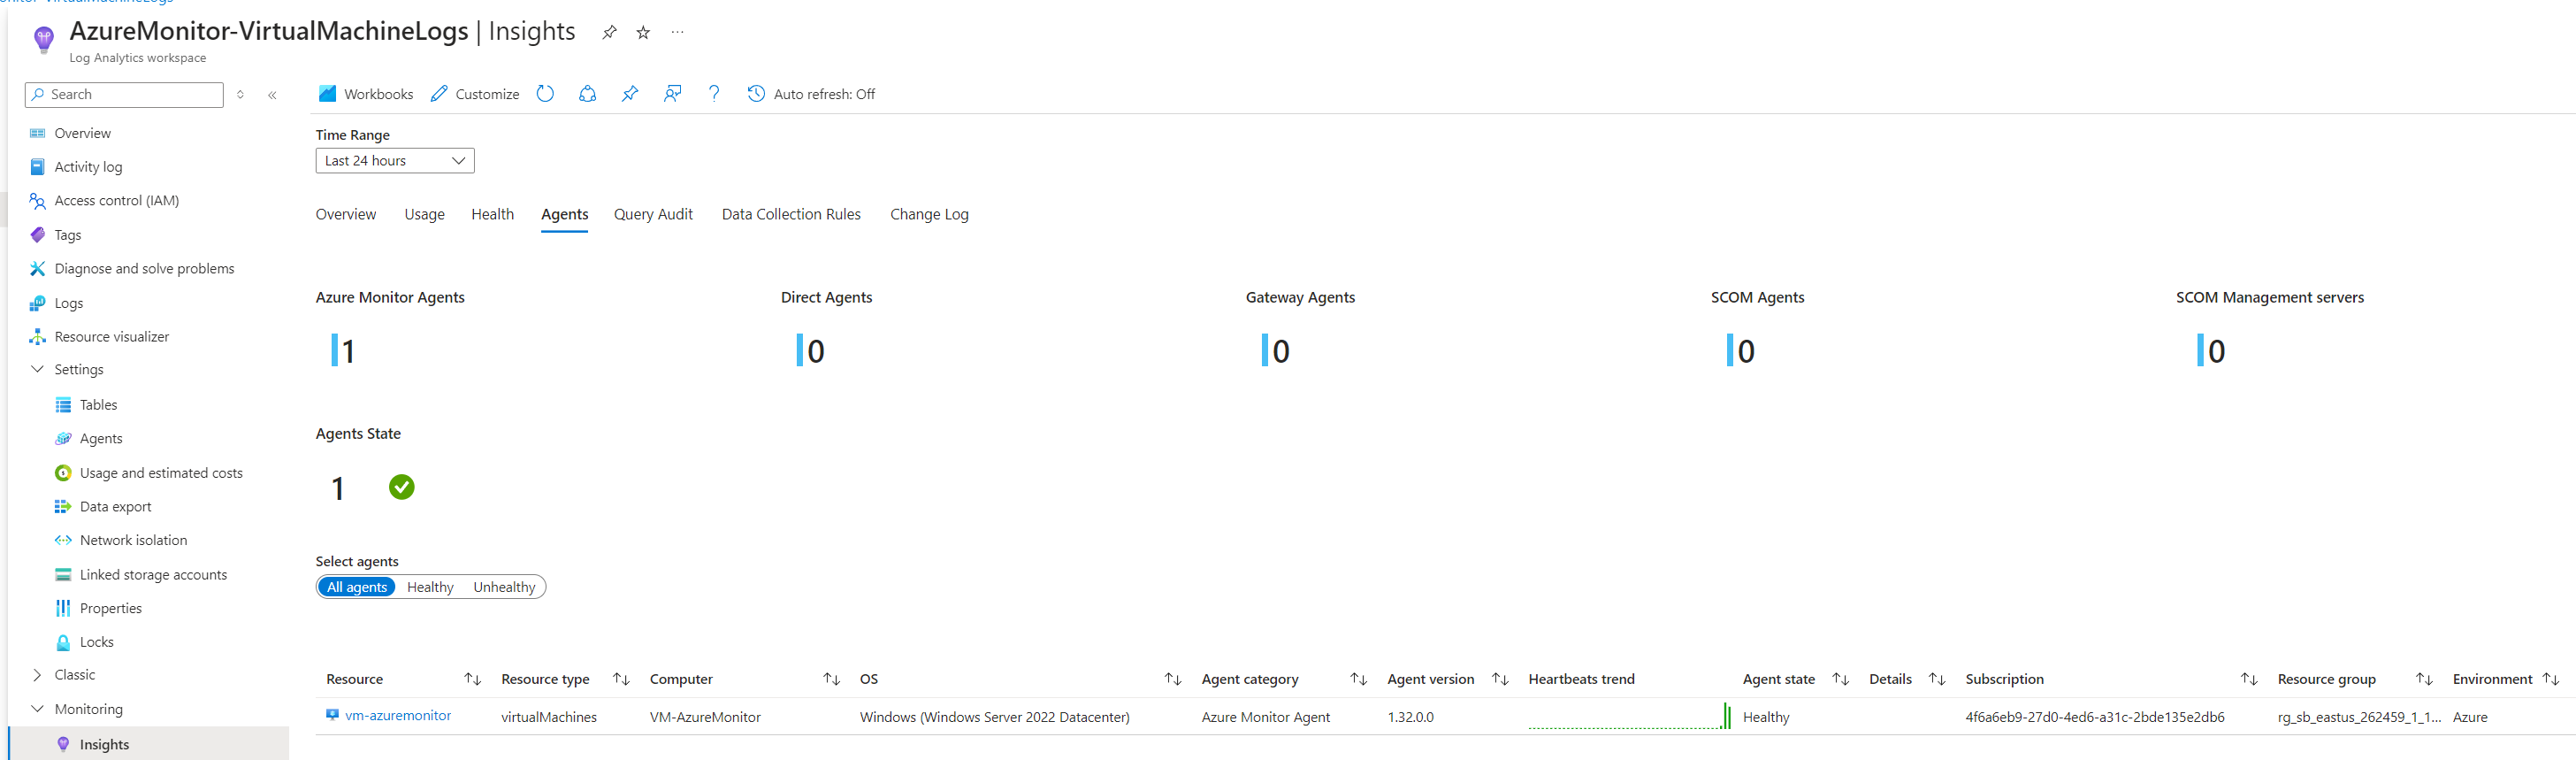
Step 30 - Go to the Log Analytics Workspace to view rich logs
We’ve now managed to see that our VM is feeding data back to us showing us data on request in the monitor tab and we can see rich logs directly from our Log Analytics Workspace if we run a query based on what we are interested in.
Your workspace should output something like this.
See insights from what resources data is bing collected from
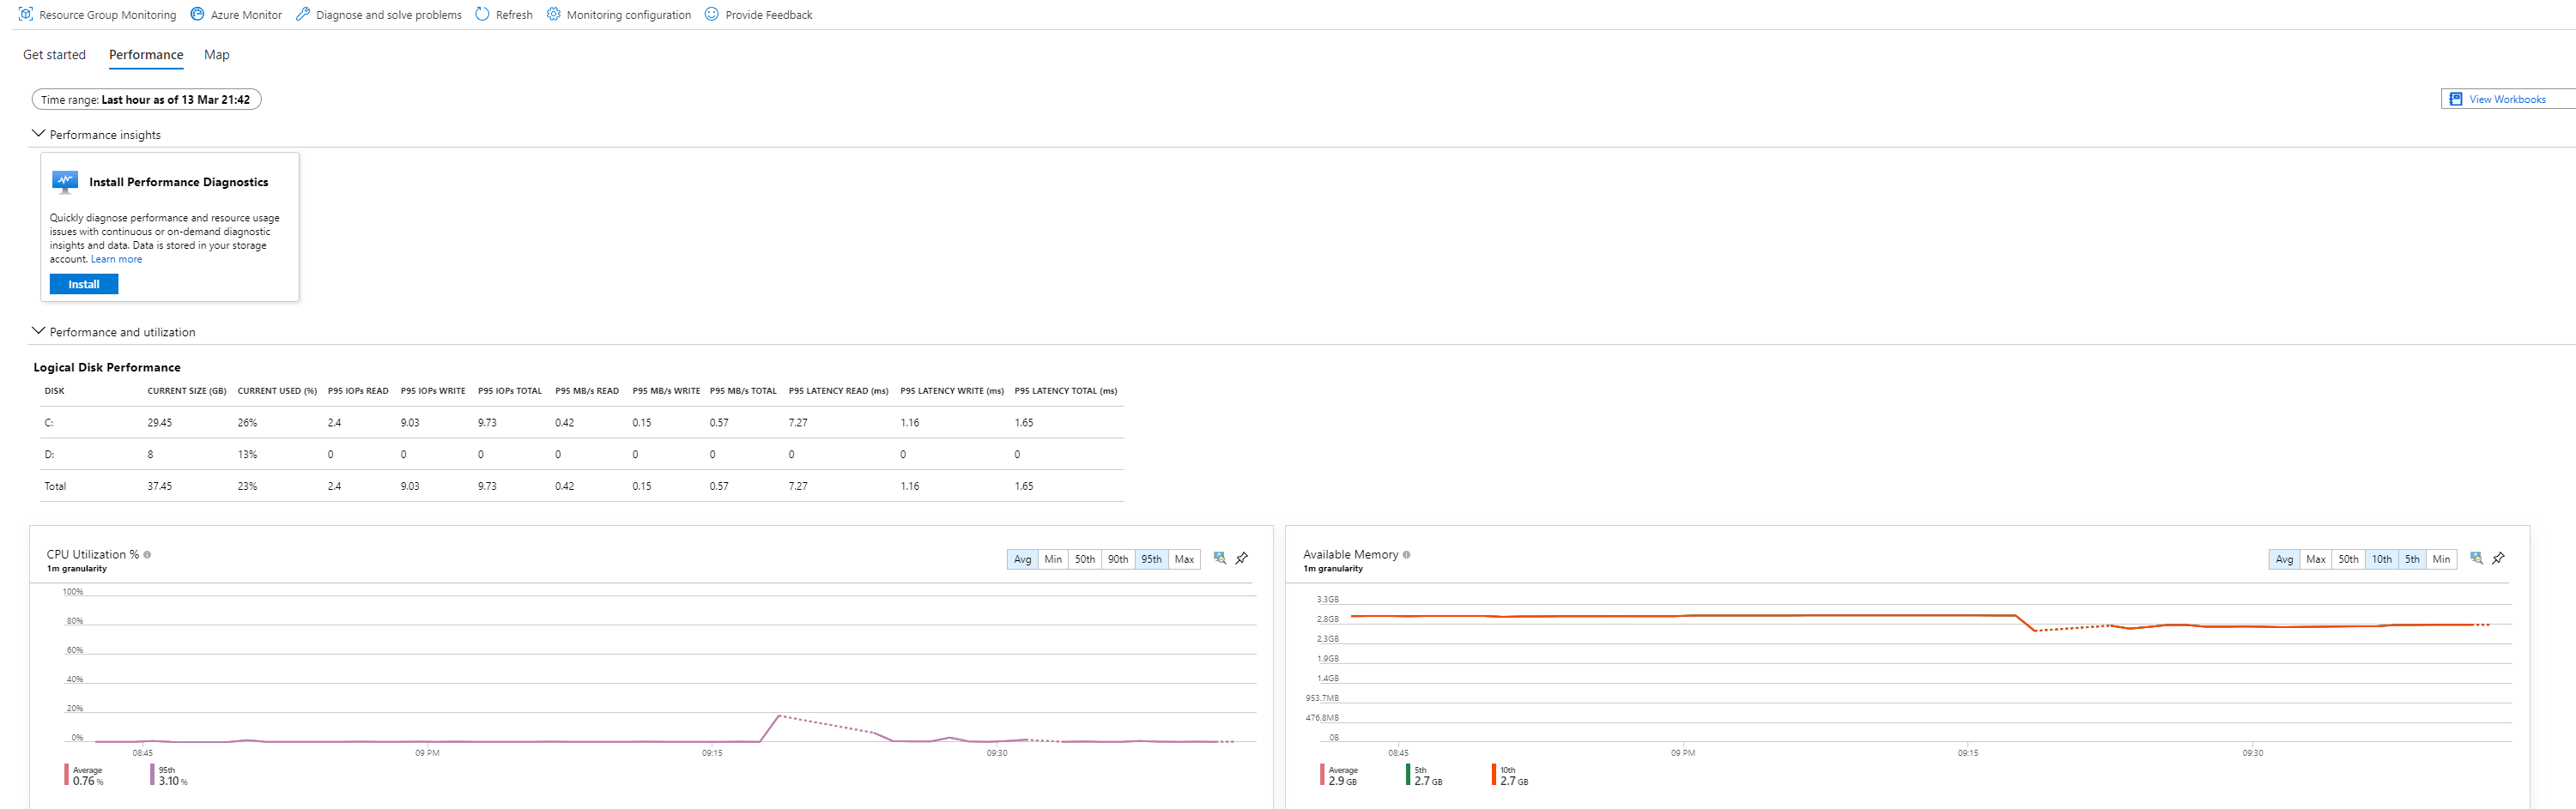
View the Insight Performance from your VM directly
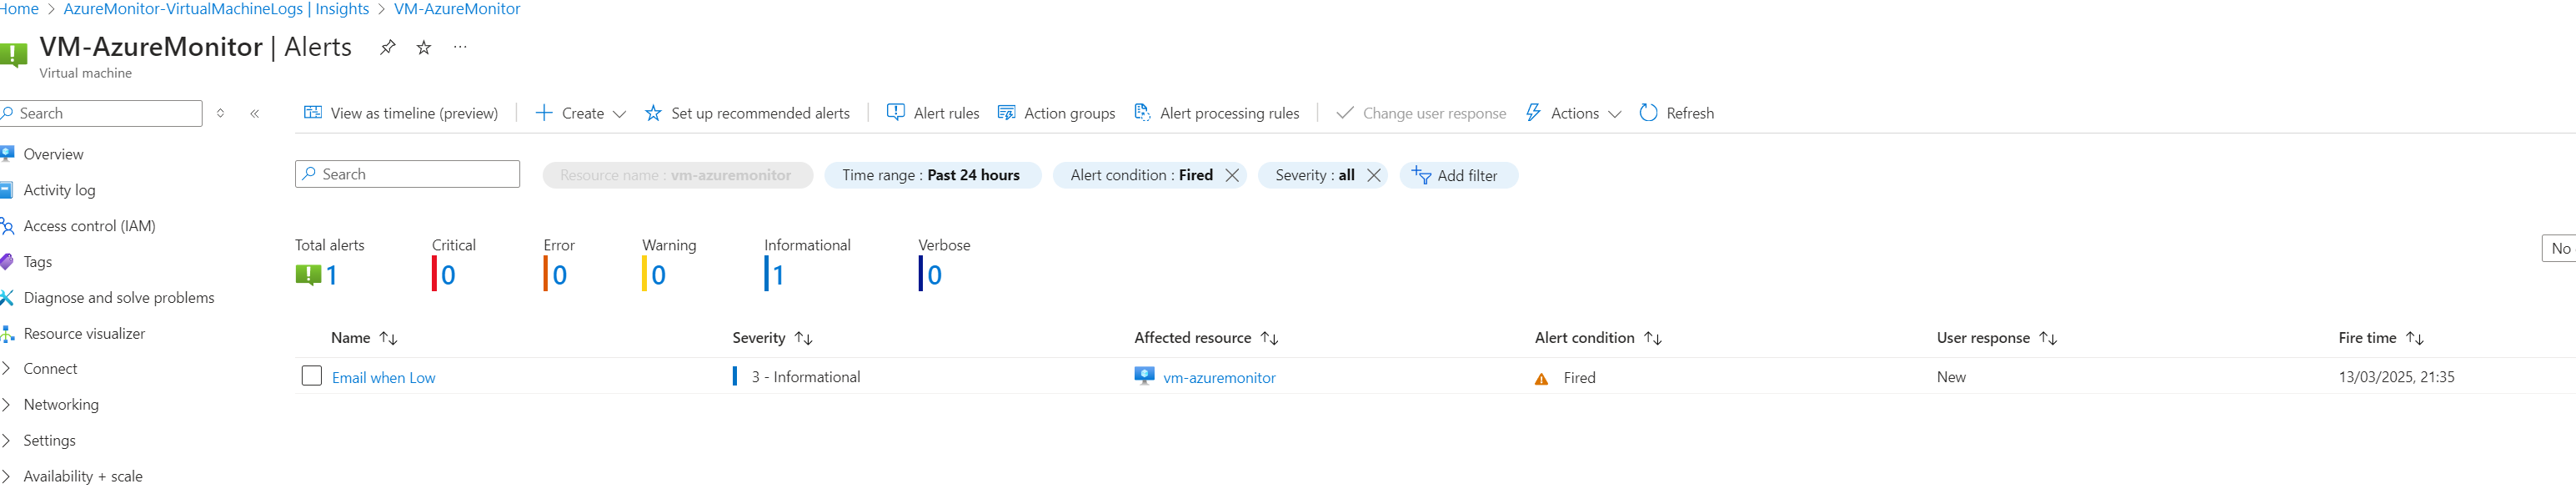
View the alerts in the VM to see if there is an issue or warning